Blog
July 14, 2020
The Unemployment Rate: Why This Time Is Different

The number you typically see reported in financial news when discussing the employment situation is the Unemployment Rate. This is a useful metric under normal circumstances, but in times of massive employment disruption like today, it can be misleading due to how it is calculated. To get a basic understanding of the employment situation, it’s important to understand how the Bureau of Labor Statistics (BLS) categorizes the working population.
At the highest level, is the Civilian Non-Institutional Population. This is the total working age (16 or older, non-military, non-institutionalized) population. It consists of the Civilian Labor Force and Persons Not in the Labor Force. The Civilian Labor Force is every person who is either employed or unemployed, but has made an active attempt to look for a job in the last four weeks. Persons Not in the Labor Force are persons who have not made an attempt to find a job in the last four weeks, and thus have been excluded from the labor force by the BLS.
When calculating the unemployment rate, the BLS looks at the number of Unemployed/Civilian Labor Force. It excludes Persons Not in the Labor Force (those who have not looked for a job in the last four weeks).
The table below will illustrate why this nuance is important.

Source: Bureau of Labor Statistics; Humanity’s Calculations
The top line shows the number of people employed from February to April of this year. As COVID related shutdowns started in March, you can see the number of people employed in March and April dropped by 3 and 22.4 million respectively. However, the number of unemployed over the same period increased by only 1.4 and 15.9 million respectively. You can see the discrepancy is roughly accounted for in the increases in the Not in the Labor Force category.
As a reminder, this category includes people who don’t have a job and had not actively looked for a job in the last four weeks. But as you can see, it represents a large portion of the people who were employed in February, but no longer have employment. This is important because when the news reports the unemployment percentage, it is only looking at the unemployment line, and is excluding any unemployed people who haven’t actively looked for a job in the last four weeks.
Under normal circumstances, this would be fine, as the number of Persons not in the Labor Force generally fluctuates very little. As you can see in the two charts below going back to when the metric was first tracked in 1975, we’ve never seen it move like it did this March and April.

Source: Bureau of Labor Statistics; Humanity’s Calculations
Prior to COVID, this number was between 36%-38% of the Civilian Non-Institutional Population for a decade and by April had spiked to 40%.
This is why it is problematic to rely on the unemployment rate published by the BLS without digging into the numbers for more context. Uniquely to this crisis, if you rely on the unemployment rate alone, you miss the impact of the over 8 million people who lost their jobs but are excluded from that measurement.
This led me to the question: Why have so many people who have lost their jobs not actively searched for a new job in the previous four weeks (defined as Persons Not in the Labor Force)? As you can see from the chart above, we didn’t see similar spikes during the .com bubble of the late 1990s or the Great Recession in 2008.
The answer was much simpler than I expected: It’s hard to search for a job in the middle of a pandemic. If you are a hospitality worker who has been laid off due to hospitality businesses being shut down in your area, there is nowhere for you to go look for a job. So while the Persons Not in the Labor Force measurement is typically meant to capture people who have given up on their job search, in this case, it includes many people who would like to work but have been prevented from job searching due to the pandemic.
Within the classification of Persons Not in the Labor Force, the BLS identifies a subset of Persons who Currently Want a Job. As you can see in the table below, this number spiked in April.
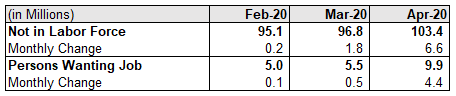
Source: Bureau of Labor Statistics; Humanity’s Calculations
As a ratio of Persons Not in the Labor Force, it hit the highest level since 1994 when the BLS began measuring it.

Source: Bureau of Labor Statistics; Humanity’s Calculations
It is important to say that there is nothing intentionally misleading about the unemployment numbers as they are reported by the BLS. The numbers are all categorized appropriately based on how they have always been measured. The BLS even published an FAQ to help people better understand the numbers. The challenge is that the nature of the economic disruption is different than any we’ve seen since the BLS started to collect and report on these numbers in 1947. As a result, if you are only looking at the headline unemployment rate, it is missing a large number of unemployed people who actually want jobs, but are incapable of actively searching for them due to the virus-related shutdowns.
Top trending